library(shiftCenterWorldMap)
#> The legacy packages maptools, rgdal, and rgeos, underpinning the sp package,
#> which was just loaded, will retire in October 2023.
#> Please refer to R-spatial evolution reports for details, especially
#> https://r-spatial.org/r/2023/05/15/evolution4.html.
#> It may be desirable to make the sf package available;
#> package maintainers should consider adding sf to Suggests:.
#> The sp package is now running under evolution status 2
#>      (status 2 uses the sf package in place of rgdal)
library(tidyverse)
#> ── Attaching core tidyverse packages ──────────────────────── tidyverse 2.0.0 ──
#> ✔ dplyr     1.1.2     ✔ readr     2.1.4
#> ✔ forcats   1.0.0     ✔ stringr   1.5.0
#> ✔ ggplot2   3.4.2     ✔ tibble    3.2.1
#> ✔ lubridate 1.9.2     ✔ tidyr     1.3.0
#> ✔ purrr     1.0.1
#> ── Conflicts ────────────────────────────────────────── tidyverse_conflicts() ──
#> ✖ dplyr::filter() masks stats::filter()
#> ✖ dplyr::lag()    masks stats::lag()
#> ℹ Use the conflicted package (<http://conflicted.r-lib.org/>) to force all conflicts to become errors
library(sf)
#> Linking to GEOS 3.11.0, GDAL 3.5.3, PROJ 9.1.0; sf_use_s2() is TRUE
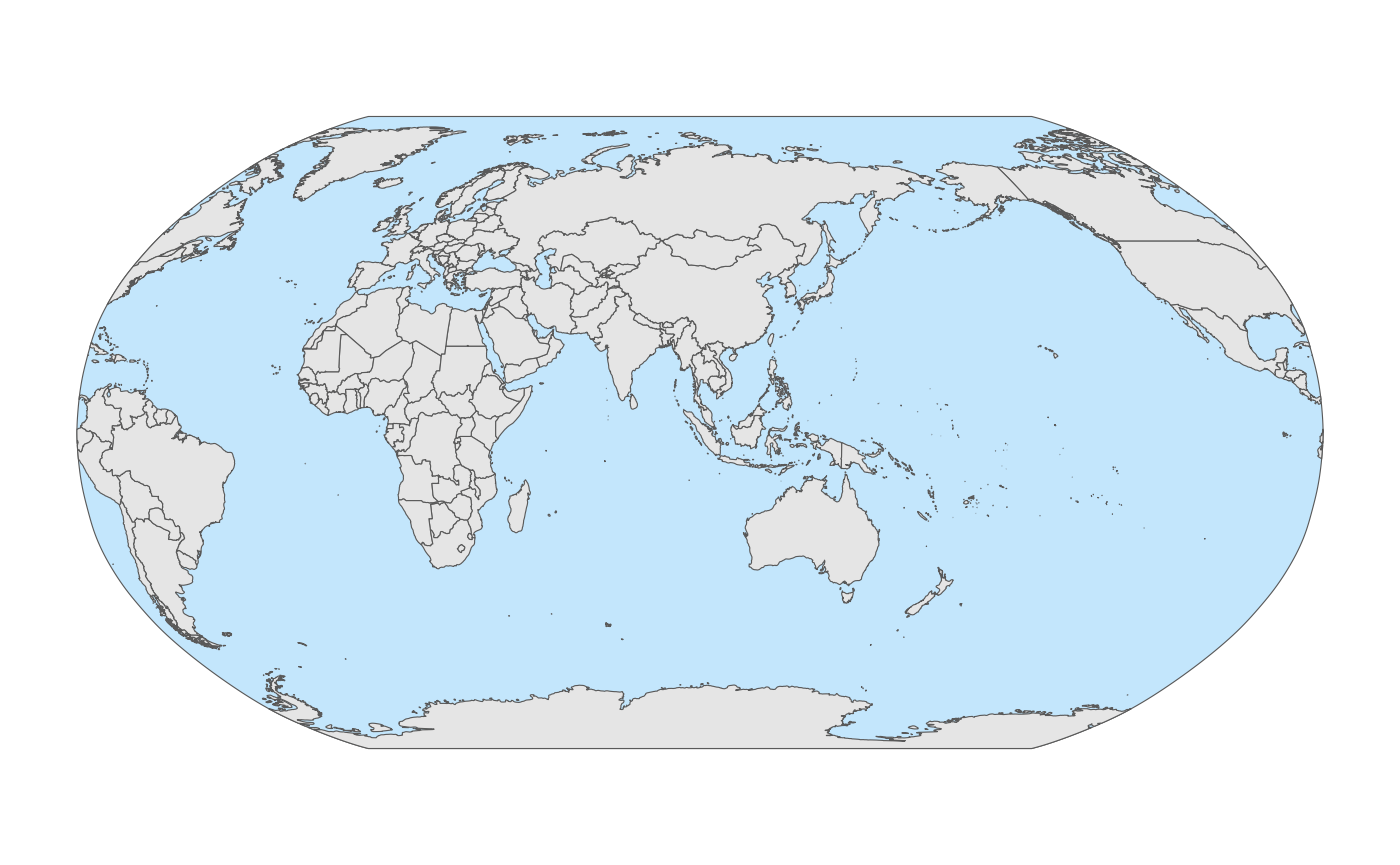
plot world map with custom center
# countries
center = 100
sf.world = create_world_map_custom_center(center)
#> Spherical geometry (s2) switched off
#> although coordinates are longitude/latitude, st_intersection assumes that they
#> are planar
#> Warning: attribute variables are assumed to be spatially constant throughout
#> all geometries
#> Spherical geometry (s2) switched on
#> Spherical geometry (s2) switched off
#> Warning in st_cast.sf(., to = "POLYGON"): repeating attributes for all
#> sub-geometries for which they may not be constant
# ocean
sf.ocean = create_ocean_background(center)
# declare the robinson project with shifted center
myCrs = paste0('+proj=robin +lon_0=', center, ' +x_0=0 +y_0=0 +ellps=WGS84 +datum=WGS84')
# plot
map = ggplot() +
  geom_sf(data = sf.ocean, fill ="lightskyblue", alpha = 0.5) +
  geom_sf(data = sf.world) +
  coord_sf(crs = myCrs, default_crs = st_crs(4326)) +
  theme(panel.background = element_blank(),
        axis.ticks = element_blank(),
        axis.text = element_blank())
map
plot multiple world map with center moving on the equator with 5˚
interval
# function to plot and save
plot_map_with_moving_center <- function(center) {
  # countries
  sf.world = create_world_map_custom_center(center)
  # ocean
  sf.ocean = create_ocean_background(center)
  # declare the robinson project with shifted center
  myCrs = paste0('+proj=robin +lon_0=', center, ' +x_0=0 +y_0=0 +ellps=WGS84 +datum=WGS84')
  # plot and save
  map = ggplot() +
    geom_sf(data = sf.ocean, fill ="lightskyblue", alpha = 0.5) +
    geom_sf(data = sf.world) +
    coord_sf(crs = myCrs, default_crs = st_crs(4326)) +
    theme(panel.background = element_blank(),
          axis.ticks = element_blank(),
          axis.text = element_blank())
  # print(map)
  ggsave(paste0("tmp/world.", center,".png"), plot = map,
         units = "px", width = 800, height = 400, bg = "transparent")
}
#
centers = seq(-175, 180, 5)
for (center in centers) {
  plot_map_with_moving_center(center)
}
read the png img and animate with gifski
library(gifski)
# gifski cannot make transparent gif
infiles = paste0("tmp/world.", centers,".png")
gifski(infiles,
       gif_file = "man/figures/animation-world.gif",
       width = 800, height = 400, delay = 0.2)
# try save_gif with expr to plot
plot_map_with_moving_center <- function(center) {
  # countries
  sf.world = create_world_map_custom_center(center)
  # ocean
  sf.ocean = create_ocean_background(center)
  # declare the robinson project with shifted center
  myCrs = paste0('+proj=robin +lon_0=', center, ' +x_0=0 +y_0=0 +ellps=WGS84 +datum=WGS84')
  # plot and save
  map = ggplot() +
    geom_sf(data = sf.ocean, fill ="lightskyblue", alpha = 0.5) +
    geom_sf(data = sf.world) +
    coord_sf(crs = myCrs, default_crs = st_crs(4326)) +
    theme(panel.background = element_blank(),
          axis.ticks = element_blank(),
          axis.text = element_blank())
  print(map)
}
# plot gif expr
plot_gif_expr <- function(){
  centers = seq(-175, 180, 5)
  for (center in centers) {
    plot_map_with_moving_center(center)
  }
}
#
save_gif(expr = {plot_gif_expr()}, gif_file = "man/figures/animation-world.gif",
         width = 800, height = 400, delay = 0.2, bg = "transparent")
gif take a long time to render so here’s the pre-rendered
result